SOP Reference: MWS-M01-L5
Lesson 5: Clinical Foraging Flora
Mapping high-density Leptospermum zones for pharmaceutical-grade nectar sourcing
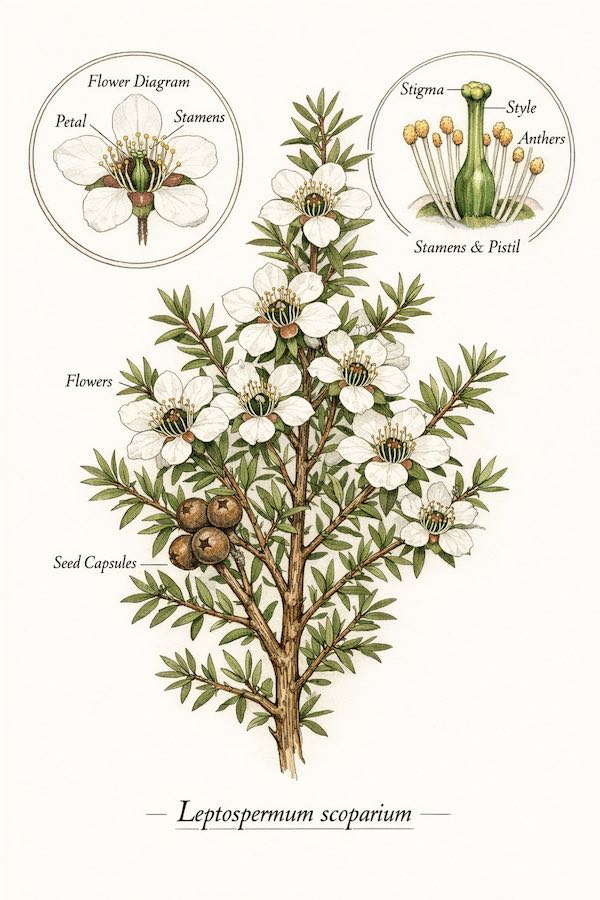
Leptospermum Scoparium: The MGO Source
Authentic Manuka honey derives exclusively from nectar of Leptospermum scoparium, a flowering shrub native to New Zealand and parts of Australia. While over 80 Leptospermum species exist, only L. scoparium produces nectar with high concentrations of dihydroxyacetone (DHA), the precursor compound that converts to methylglyoxal (MGO) during honey maturation.
Other Leptospermum species, including L. polygalifolium (Australian tea tree) and L. laevigatum, produce nectar that yields honey with negligible MGO content. Pollen DNA analysis can distinguish between species, making botanical source verification a critical component of pharmaceutical authentication.
The relationship between L. scoparium density within the foraging radius and final honey MGO concentration is nonlinear. Research demonstrates that bees preferentially forage on the most abundant nectar source. When L. scoparium represents less than 60% of flowering biomass during peak bloom, resulting honey often fails to meet minimum MGO thresholds for pharmaceutical classification.
Vegetation Mapping Protocol
Pre-Site Botanical Survey
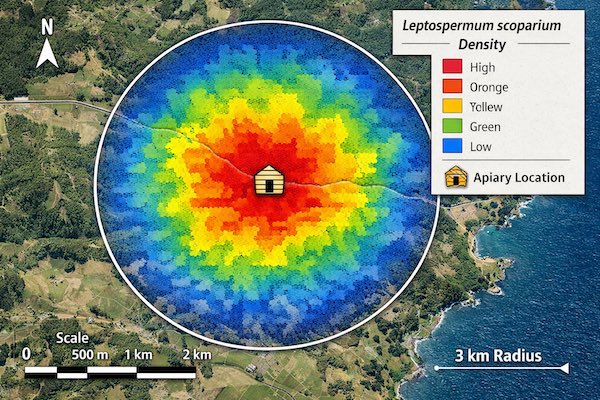
Before apiary establishment, systematic botanical surveys quantify L. scoparium density throughout the 3km foraging radius. This baseline assessment predicts honey MGO potential and identifies whether the site can support pharmaceutical-grade production.
Mapping Methodology
- Transect Establishment: Eight transects radiate from the proposed apiary center at 45-degree intervals, each extending 3km
- Plot Sampling: 10x10 meter plots establish every 250 meters along each transect
- Species Identification: All flowering plants within plots receive identification to species level
- Density Quantification: Count of flowering stems per species within each plot
- Bloom Timing Records: Phenological observations document bloom initiation, peak, and conclusion for L. scoparium and competing species
- GPS Documentation: All plot corners receive GPS coordinates for future re-sampling
- Photographic Records: Geotagged photographs document vegetation composition at each plot
GIS Analysis and Visualization
Survey data imports into GIS software for spatial analysis. Kriging interpolation generates density heat maps showing L. scoparium distribution throughout the foraging radius. These maps guide hive placement decisions, with apiaries positioned to maximize access to highest-density patches.
Minimum Density Requirements
Pharmaceutical-Grade Thresholds
Research correlating L. scoparium density with honey MGO content establishes minimum vegetation thresholds required for pharmaceutical honey production.
| L. scoparium Density | Expected MGO Range | Pharmaceutical Suitability |
|---|---|---|
| Below 40% flowering biomass | 50-150 mg/kg | Unsuitable - insufficient MGO |
| 40-60% flowering biomass | 150-300 mg/kg | Marginal - high variability |
| 60-80% flowering biomass | 300-550 mg/kg | Suitable - consistent production |
| Above 80% flowering biomass | 550-1200+ mg/kg | Optimal - premium grade potential |
These thresholds assume bloom synchrony between L. scoparium and competing nectar sources. When competing species bloom before or after L. scoparium, lower density sites may still produce pharmaceutical-grade honey if bees have no alternative forage during Manuka bloom period.
Competing Flora Management
Non-Target Nectar Sources
Even within high-density L. scoparium stands, competing nectar sources can dilute honey MGO content. Bees exhibit preferences based on nectar sugar concentration, accessibility, and proximity. Managing competing flora maximizes Manuka purity.
Common Dilution Sources
- Clover (Trifolium species): Abundant, accessible nectar that bees prefer when available
- Eucalyptus: Trees producing copious nectar that can dominate bee foraging
- Pasture Flowers: Mixed wildflowers in agricultural areas competing during bloom period
- Garden Escapees: Introduced ornamentals that naturalize in native bush
Selective Vegetation Management
Within owned or controlled land, selective removal of competing nectar sources enhances Manuka purity. This management uses mechanical methods only - herbicide application violates pharmaceutical protocols even for non-target vegetation.
Timing of vegetation management matters. Removal before bloom initiation prevents seed production and reduces future competition. Post-bloom removal has minimal effect on current season honey production.
Phenology Monitoring and Bloom Prediction
Understanding Bloom Triggers
L. scoparium bloom timing varies by microclimate, elevation, and annual weather patterns. Accurate bloom prediction allows for strategic hive management, ensuring colonies reach peak strength coincident with nectar flow.
Growing Degree Day Models
Accumulated heat units from winter solstice predict bloom initiation with reasonable accuracy. Leptospermum scoparium bloom typically initiates after accumulating 800-1000 growing degree days (base 10 degrees Celsius), though local calibration improves predictions.
Monitoring Network
Pharmaceutical apiaries establish phenology monitoring plots at multiple elevations and aspects within the foraging radius. Weekly inspections during the pre-bloom period document bud development stages:
- Dormant - no visible bud swelling
- Bud Swell - green tissue visible at bud tips
- Green Bud - expanding buds with visible flower structure
- White Bud - petals visible but flowers still closed
- Early Bloom - less than 10% flowers open
- Peak Bloom - 50-80% flowers open
- Late Bloom - most flowers open, some petal drop
- Post Bloom - nectar flow concluded, seed capsule development
Bloom predictions derived from this monitoring inform decisions about colony preparation, supplemental feeding cessation, and super placement timing.
Pollen Analysis and Source Verification
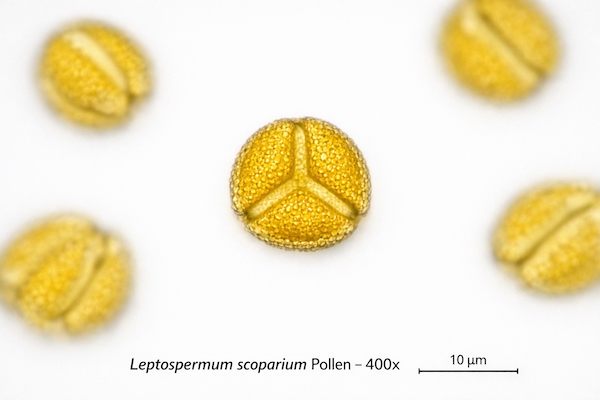
Melissopalynology Protocols
Pollen analysis provides botanical source verification that complements MGO testing. Pharmaceutical Manuka honey must contain minimum 70% L. scoparium pollen by count to verify monofloral status.
Sample Preparation
- Dilution: 10 grams honey dissolved in 20ml warm distilled water
- Centrifugation: Spin at 3000 RPM for 10 minutes to pellet pollen
- Acetolysis: Chemical treatment clarifies pollen walls for identification
- Mounting: Pollen suspension mounted on microscope slides in glycerin jelly
- Counting: Minimum 500 pollen grains identified and counted per sample
- Calculation: Percentage composition calculated for each species
Interpretation Standards
| L. scoparium Pollen % | Classification | Pharmaceutical Status |
|---|---|---|
| Below 45% | Multifloral | Not pharmaceutical grade |
| 45-70% | Manuka Blend | Not pharmaceutical grade |
| 70-85% | Monofloral Manuka | Pharmaceutical eligible |
| Above 85% | Premium Monofloral | Pharmaceutical premium |
DNA Analysis for Species Authentication
Molecular Verification
Pollen morphology can be ambiguous between closely related Leptospermum species. DNA-based authentication provides definitive species confirmation. Both nuclear and chloroplast DNA markers differentiate L. scoparium from other species with high confidence.
Testing Methodology
Commercial laboratories specializing in honey authentication extract DNA from pollen pellets following acetolysis. Polymerase chain reaction (PCR) amplifies species-specific genetic sequences, with results interpreted using validated reference databases.
DNA testing costs more than traditional pollen analysis but provides unambiguous results. Pharmaceutical operations typically perform DNA authentication on a statistical sampling basis rather than testing every batch, reserving molecular methods for disputed samples or export documentation requirements.
Seasonal Monitoring and Adaptive Management
Within-Season Adjustments
Real-time monitoring of bee foraging behavior and early honey composition allows for mid-season course corrections. If pollen analysis or preliminary MGO testing indicates excess competing nectar, management interventions can refocus foraging.
Intervention Strategies
- Water Source Relocation: Moving water stations to position bees closer to prime Manuka stands
- Hive Repositioning: Physically relocating hives to higher-density Manuka areas if initial placement proves suboptimal
- Colony Division: Splitting strong colonies into satellite yards positioned throughout Manuka concentrations
- Harvest Timing: Early harvest during peak bloom captures highest Manuka content before competing species begin flowering
Documentation and Traceability
Botanical Records Management
Comprehensive documentation of floral resources within the foraging radius supports pharmaceutical authentication and provides evidence of due diligence in source management.
Required Documentation
- Annual vegetation survey maps showing L. scoparium distribution
- Phenology records documenting bloom timing and duration
- Competing flora inventory with bloom synchrony analysis
- Pollen analysis results for all harvested honey
- DNA authentication certificates for export lots
- Photographic documentation of vegetation throughout foraging radius
- Climate data showing temperature and precipitation during bloom
These records integrate into the overall chain-of-custody documentation that accompanies pharmaceutical honey from hive to hospital.
Critical Takeaways
- Leptospermum scoparium must represent 60%+ of flowering biomass for consistent pharmaceutical MGO levels
- Systematic vegetation mapping using transect surveys quantifies Manuka density
- Growing degree day models predict bloom timing for optimal colony preparation
- Pollen analysis verifies minimum 70% L. scoparium content for monofloral classification
- DNA authentication provides definitive species confirmation when required
- Competing flora management enhances Manuka purity through selective vegetation control